When you login to the online customer portal, you will see a graph for the most recent Peak Time Rebates event which shows how you performed.
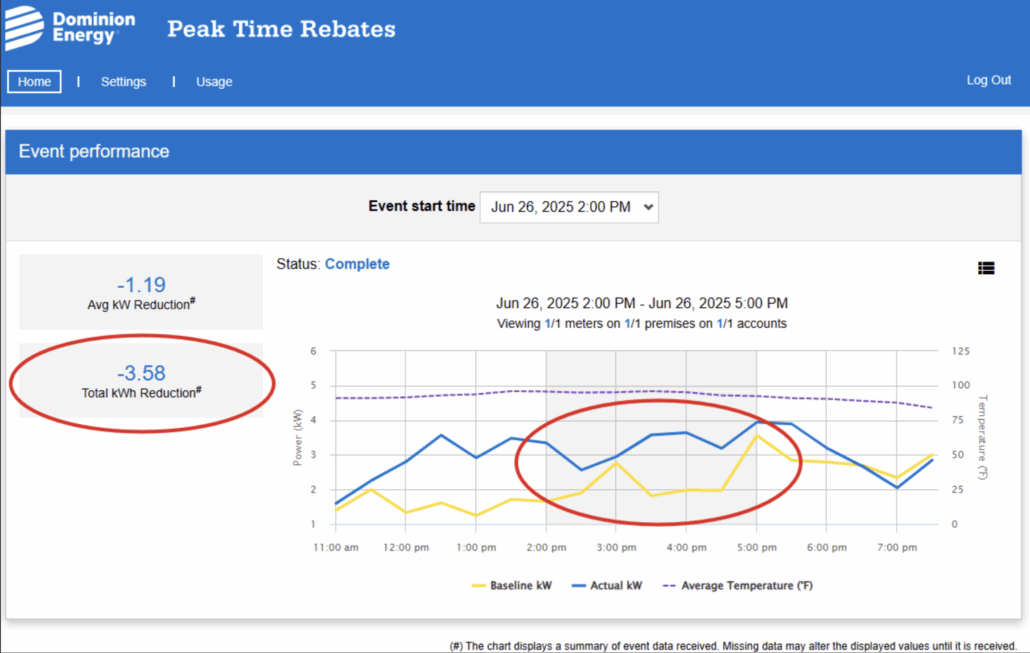
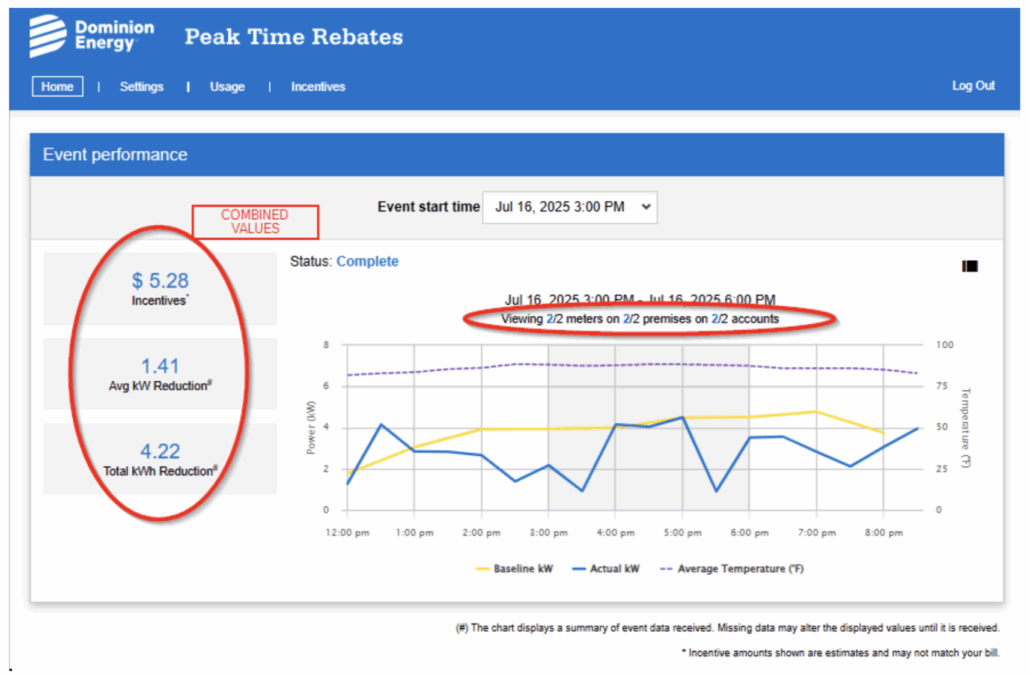
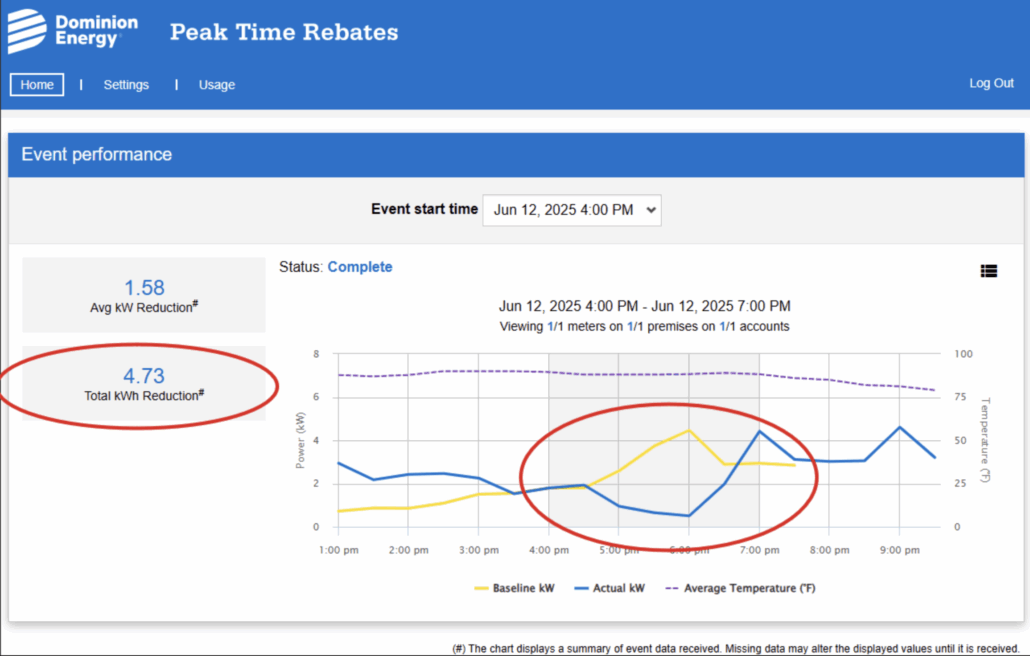
The blue line, “Actual kW” represents your actual usage that day and during the called event. Any energy reducing actions you took will be reflected in this line.
The yellow line represents your “Baseline kW” which shows an estimate of how much electricity you would have used on a typical day if there hadn’t been a Peak Time Rebates event.
Example of customer who saved energy:
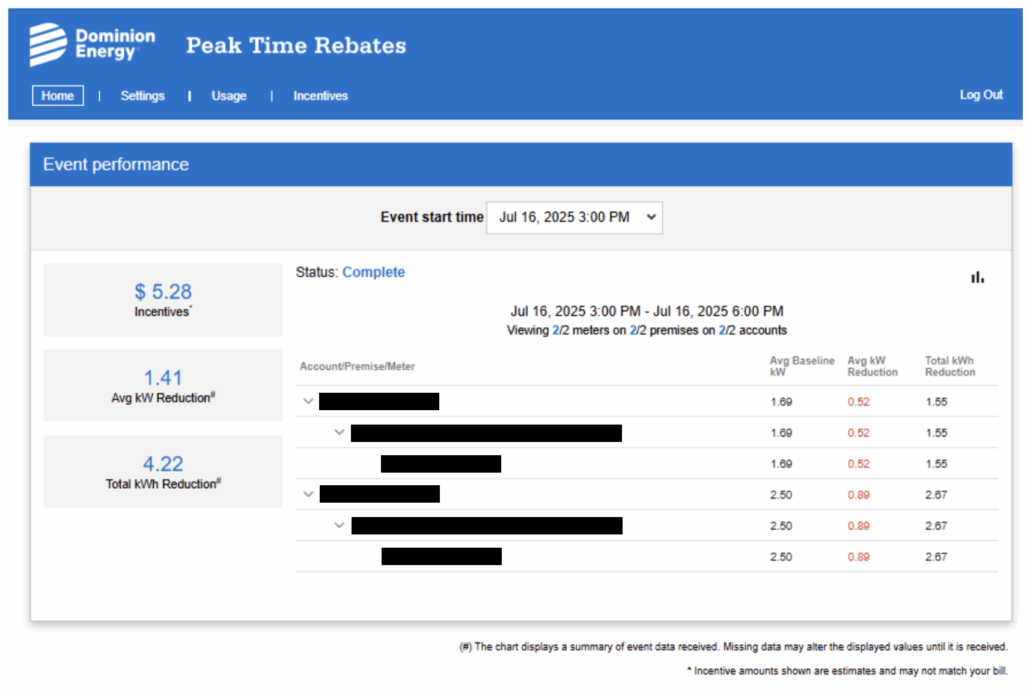
If the Baseline kW (yellow line) is higher than your Actual kW (blue line) during the event window, that means you successfully reduced your energy use and achieved an incentive. That difference is what we consider your energy savings, and it’s what helps determine your reward. To calculate your savings for a specific event, just multiply the “Total kWh Reduction” by $1.25.
Example of customer who did not save energy:
If the Baseline kW (yellow line) is lower than your Actual kW (blue line) during the event window, that means you did not reduce your energy use enough to earn an incentive for this event. This simply means you used more electricity during the event than what we estimated based on your typical usage.
You will also see a negative number for your Total kWh Reduction. Don’t worry—there’s no penalty for this. It simply means you didn’t receive a rebate for that particular event. We understand it can be tough to cut back on energy during extremely hot or cold days, and sometimes even your usual energy-saving habits might not have the same impact.
